Abstract
A model for water evaporation kinetics is presented that relies exclusively on parameters associated with the liquid phase. It produces an effusion rate that does not depend on external measures of vapor pressure or gas phase temperature. Using the kinetic theory of gasses1 to match impingement it predicts the temperature dependence of equilibrium vapor pressure – the Clausius-Clapeyron equation — to within 3% rms average from zero to 100 oC. The model uses a multiplier of the measured surface tension and a phonon propagation speed but no other adjustable parameters beyond geometries and phonons. The model does not assume equilibrium beyond that implied by the surface tension measurement. This result suggests that evaporation is defined by the energy/mass balance at the interface and the transport of energy in the liquid phase. It calls into question evaporation theories that rely on the degree of vapor phase saturation as a primary determinant of evaporation rate. Proposed here is a phono-physical reaction taking place at the surface, probed with a quantum chemistry analysis of a molecular cluster as a sort of macromolecule to describe the phonon structure of water molecules at a surface.
Keywords: Hydrogen bond, phonon, water evaporation, condensation, Bose-Einstein, quantum chemistry, phase change radiation,
Introduction
The phase changes of water are a matter of fascination for most who study them. In particular, understanding of evaporation is needed to manage all sorts of industrial and agricultural processes as well as climate models. A classical model for evaporation is that of Hertz-Knudzen1 recently employed by Kazami et al2.
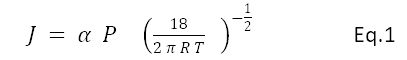
J is the evaporative effusion in moles per second, a is the evaporation coefficient, 18 is the molecular weight of water, R is the gas constant, T absolute temperature of the interface, P is the difference between the saturation and the actual pressure. Beyond Hertz-Knudzen there are many elaborations and experiments going back decades. Most evaporation models use the saturation vapor pressure P as a scaling factor as evidenced by the term

That is to say, they are based at least in part on gas phase thermodynamics and equilibrium measures.
There is substantial evidence that the liquid phase of water is stabilized by hydrogen bonds3, as distinct from the often studied 6-12 interaction potentials that are the usual basis for Debye phonons. Based on electrical properties, Elton 4 and Elton and Fernández-Serra5 say that the hydrogen bond (H-bond) network supports optical phonons. With the finding of high energy H-bond phonon activity the possibility exists of a model where evaporation is limited by energy transfer to the surface by phonons. Heat energy in the interior of crystalline solid phases resides in phonons as described by Debye theory for crystalline solids. While there does not currently seem to be a broadly accepted parallel to the phonon model for non-crystalline condensed phases or liquids available to describe water, it is encouraging that the near infrared optical spectra of ice and water are quite similar6. It is likely that on short time scales water acts like a glass. Molecular models that can match the crystal phases may be useful for liquids as well. Whatever model emerges7, it is very likely to involve Bose-Einstein statistics.
Evaporation Model
The basic idea of the model here is that phonons with sufficient energy arriving at the water surface from the interior can release a molecule to the gas phase. By virtue of geometry a water molecule on the surface has fewer bonds than one in the interior. The model requires a description of the energy states of water, a view of how this energy moves, and the energy cost to get to the gas phase.
The distribution of phonon modes in water is different from Debye theory. Debye theory presumes a model of balls coupled by springs. A model for liquid water is better described as a limited variety of electrostatically coupled dipoles. Because of the great differences between the classical Debye model density of states (DOS) and those of liquid water, a large part of this paper will be devoted to describing the DOS of liquid water. Describing the DOS at the interface requires a model for the structure of a water surface. The model used here is a more or less random blob of water molecules, with geometry optimized by the program MOPAC8. Other modeling programs could be used, but there are advantages to MOPAC. The logic of using a blob of molecules as a proxy for a surface is that, if the surface of a liquid is those molecules at or near an interface, in a blob of a few tens of molecules most molecules are on the surface. Given a molecular configuration we can calculate the vibration states, and from the vibration states we can find the fraction of vibration energy that can release water to the gas phase. While it is conventional to use periodic boundary conditions for phonon calculations, the cluster calculation serves as a sort of free standing molecule. In the discussion to follow we will use the words state and mode interchangeably, i.e., DOS is DOM.
Phonon Structure for a Water Cluster of 33 Molecules
Papoular9 explains how MOPAC vibrations can be used to map phonon structure in large molecules. The phonon structure of a 33 molecule water cluster was constructed using MOPAC6 with PM310. The cluster used to generate Figure 1 was constructed one molecule at a time to see how the distributions evolved as the cluster increased. Using the PM3 Hamiltonian, a single gas molecule has the vibrations11 (v1:3657,v2:1595,v3:3756)/cm. Somewhat inaccurately MOPAC6/PM3 describes these as (3871, 1743,3992)/cm. The v2 band arises largely from the scissors motion or libration band of the protons. The other two are vibrations of protons relative to the oxygen. As the cluster is increased in size, the bands widen and the low energy bands appear. Using PM6-ORG the numbers are (3179, 1675, 3476).
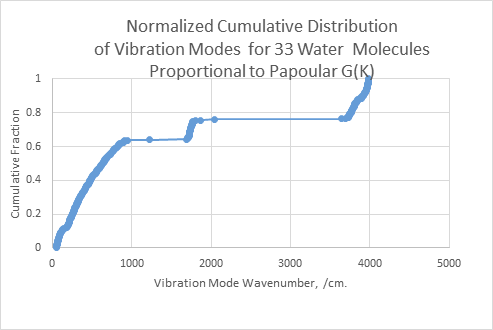
Figure 1: Cumulative Distribution of Phonon Vibration Modes for a 33 molecule blob using MOPAC6/PM3. The cumulative distribution of a sorted set of vibrations is plotted as the mode index on the y axis versus the wavenumber energy of each mode on the x axis. This function is proportional to the Papoular9 G function. The energies could be scaled down by 6% to better match the experimental gas phase data.
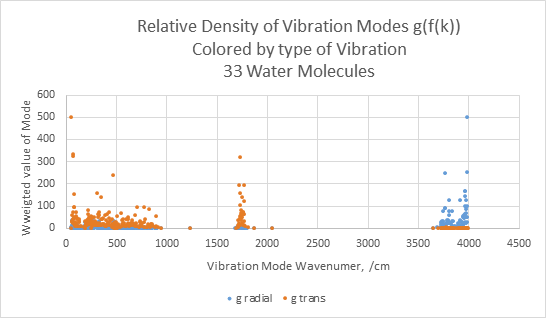
Figure 2: Relative density of vibration modes (related to the Papouolar g(k) or DOM function) colored by the type of vibration, plotted versus the wavenumber of the vibration frequency. Papoular describes the density of modes as being the derivative of the G(f(k)) function. Shown in Figure 2 is the density of modes in the mode index space. The entries are colored according to the vibration mode: orange for radial, blue for transverse and likely higher optical activity. The approximation used here is g( f(k)) ~ 1/( f(k+1) – f(k)), plotted versus (f(k+1) + f(k))/2 . For comparison, the classical Debye density of states is a smooth parabolic function of wave number up to the Debye limit.
Figure 2 can be compared to Figure 10.14 of Elton4 supporting dielectric susceptibility. The analysis by Elton was conducted in part to show that the macroscopic dielectric susceptibility can be related to molecular behavior. Those findings are used here to show that the 33 molecule Mopac6/PM3 phonon model captures much of the detail needed to describe interaction with high frequency electric fields. In particular there are frequency regions at which there are no nearby vibration modes.
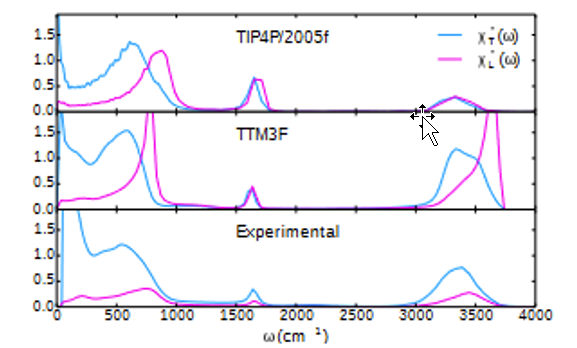
Figure 3: Elton Figure 10.14: Imaginary parts of the static transverse and longitudinal dielectric susceptibility for TIP4P/2005f and TTM3F models, and experimental data.
By inspection, the MOPAC mode calculation describes the shape of the susceptibility data quite well, assuming the 6% rescaling of PM3 energies. This correspondence is important because Elton’s experimental data is derived from macroscopic electrical measurements while Figs 1 and 2 show the vibration states taken directly from a MOPAC calculation on a blob of 33 molecules constructed one water molecule at a time.
Phase Change Radiation and DOMs
The density of modes, DOM figure 2, is related to the imaginary part of the dielectric susceptibility, which is proportional to the extinction coefficient. Papoular9 discusses the calculation of emission spectra of large molecules from phonon modes for which calculation DOM is a primary factor.
Multiple investigators have reported infrared radiation associated with the condensation of water. The bands observed are relatively broad and varying in width with temperature, but surprisingly not peak wavelength. The observed peak wavelengths do not obviously relate directly to gas phase spectra. For example, Wang12 and Wu13 report peaks at 2.75 microns(3634/cm) and 5.5 microns(1818/cm) . Tartachenko et al14 report broad complicated spectra peaking at 12 microns (833/cm) and 13 microns(770/cm). The radiation peaks (3634/cm, 1818/cm, and 833 and 770/cm) are consistent with the modes in the density of modes plot, Figure 2. The types of modes shown in Fig. 2 suggests that phase change radiation is radiation by the vibration modes. This topic is reviewed by Xiea15 et al. The interpretation here is that there is thermal radiation due to heating from condensation.
To summarize, the MOPAC mode distribution seems to be real, and relevant to exchange of energy across the interface.
Threshold Energy for Removal of a Molecule
To estimate the heat necessary to release a molecule of water from the liquid phase, we assume that water is composed of square blocks, and that the energy ST to clear one face of the liquid surface is given by the experimental surface tension for which a summary is:

Eq. 2 is taken from Duan et al10, in units of dyne/cm or millijoules/meter sq. for Tc in degrees Celsius.
Assume that the energy to release a molecule of water is 6 times the energy to produce a surface. Using Eq. 2, the resulting energy ranges from 26.31 kJ at zero oC to 20.49 kJ at 100 oC. At most temperatures below the boiling point this energy is greater than the single hydrogen bond3 20.83 kJ/mole but much less than the heat of vaporization of 43.9 kJ/mole at 0 oC . A light quantum with the energy necessary to break 1.25 hydrogen bonds at 0 oC has a wavelength of 4.6 microns.
Where h is Planck’s constant, the Eq. 2 threshold energy (thresh.) converted to a frequency fT is

The accuracy of the fit shown in Table 1 below can be improved by a fixed factor of 1.065 using the PM6 Hamiltonian.
Internal Energy of Water Phonons
Note: In this paper we use notation h*frequency for energy of a phonon. It is more common of late to use ħ ω and historically ħ w, but sometimes h w. On small screens it is often difficult to distinguish ω and w, and ħ versus h, The notation hf is unambiguous and clear.
For a given configuration of atoms, for example the blob of 33 water atoms used in figure 1, where the list of M frequencies sorted in magnitude is known, the internal vibration energy Uf at vibration mode i with frequency fi is that of the generalized Einstein model, described by Schwartz16 and Kittel11 .
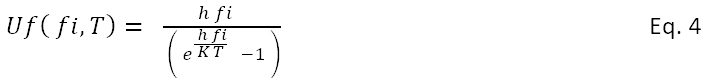
h is Plancks constant, K is Boltzman constant, T is temperature.
The vibration internal energy, the vibrational enthalpy, is the sum across all M modes. This energy is appropriate for a specified configuration of atoms with volume V, taken here as 2.98 cubic angstroms per water molecule.
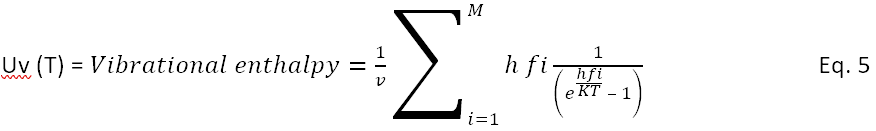
where v is the volume for the blob.
Heat capacity is one external measurement that is directly related to internal energy modes. Heat capacity is the derivative of the internal energy with respect to temperature. The heat capacity attributable to vibration is approximately Uv(T+1) – Uv(T). For a set of vibration states using PM6 this number is within 2% of the MOPAC vibrational heat capacity for the 33 water molecules at 0 C. This number is approximately half of the experimental value for water. This is a reasonable match because MOPAC Uv does not include rotation and translation degrees of freedom.
Evaporation by Phonons
Given the internal energy, the rate of movement of the energy is internal energy * speed of motion. The correct speed for calculating the rate of progress of energy among water phonons is not clear. At a minimum it would be the speed of sound. But the speed over short distances could be as high as the speed of light, though slower if averaged over many jumps. Elton et all4,5 report speeds of 1700 m/s for some modes. Peluso17 describes speeds as high a 4000 m/s for short distances. Water phonon modes derived from hydrogen bonds locally are coupled dipoles, for which the energy propagation speed should be the speed of light. For this model we will use the Elton’s speed of 1700 m/s. It is not clear if the appropriate speed for evaporation is one of mass flow or of energy flow. This consideration suggests that the proper speed at equilibrium might be different from non equilibrium. Since the phonon population explains only about half of the heat of formation, the other half, which includes translation energy moving at the normal sound speed, could play a role in evaporation at rates higher than the incoming effusion.
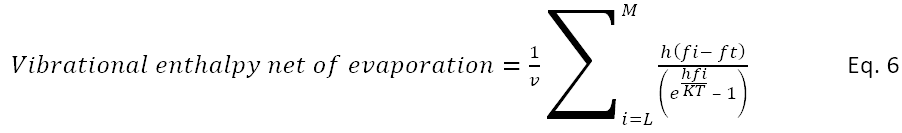
The assumption here is that a phonon in the interior arriving at the surface with an energy h fi greater than the threshold energy h ft will give up the threshold energy to release a water molecule.
If L is the index of a frequency which is greater than ft, then
The number of events is the remaining energy of the process divided by the energy of a quantum, h fi. Rearranging terms leaves the following calculation for the rate of release of water molecules by a blob surface. This analysis does not indicate what the energy of exiting molecules might be.
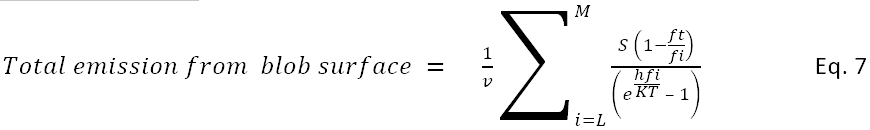
s = (speed of sound, 1700m/s)
This may be scaled to square meters with the number square angstroms of blob/square meter assuming a spherical blob with volume of 2.98 cubic Å /molecule.
Impinging Water Molecules
The number of water molecules hitting a surface at a particular temperature and pressure is the classical impingement1,18:
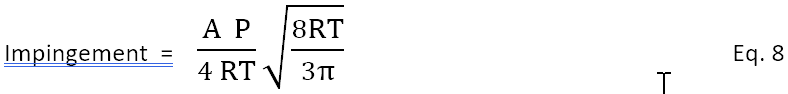
Where A is Avagadro’s number and P is pressure.
At equilibrium the impingement will equal the number of molecules leaving, given by Eq. 7.
Model Results
Listed in the table are evaporation model results for a blob size of 16, the coordinates of which are listed in the Appendix. The 16 molecule blob G function is qualitatively similar to the larger sizes but the DOS has less structure in the 0 to 1000/cm region than the larger blobs. It is used here because it should be small enough for more accurate calculations than MOPAC or calculations on small crystal structures.
Table 1: Model results for a blob size of 16 using PM6-ORG
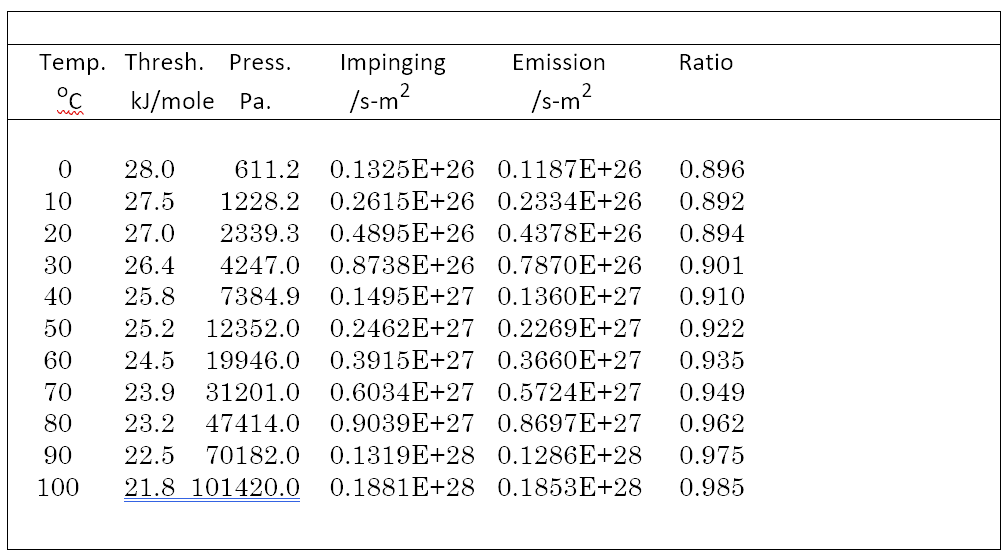
For the table the average ratio of emission to impingement is 0.929, standard deviation 0.0325, and a coefficient of variation of 0.035.
PM6-ORG blob size 33 has average ratio of 1.039 and coefficient of variation of 2.5%.
PM6-ORG blob size 65 has average ratio of 1.012 and coefficient of variation of 2.65%
The threshold listed in the table goes from 28kJ/mol (2340/cm, 5.3 mu) to 21.8 (1822/cm, 5.5 mu). For comparison, the energy of a hydrogen bond3 is 20.83 kJ (1741/cm, 5.7 mu).
Radiative Enhancement of Evaporation
A question to be answered by this study is, what is the effect of radiation on evaporation as distinct from just thermal effects? The G(f(k)) and g(k) charts shows multiple modes. The middle mode at 1750/cm is apparently the one that initiates evaporation. Both Mopac and Elton et al estimate that this mode is somewhat radiatively active. If so, and if the phonon model is relevant to evaporation, then irradiation at this mode could produce a radiatively inefficient but observable anomalous vapor pressure relative to the surface temperature. The 3750/cm band is more radiatively active, though its absorption coefficient is extremely high which would cause surface heating. The phonon model here suggests there is some direct influence of radiation on evaporation separate from the effect on surface temperature. The topic of radiative enhancement of evaporation must reference the work of Brewster and students, such as Wang et al16 who have shown that thermal radiation can enhance evaporation.
Statistical Rate Theory
Statistical rate theory10,20 (SRT) of evaporation includes vapor phase phonon terms using gas phase vibration parameters: (v1:3657,v2:1595,v3:3756)/cm. Most articles on SRT do not mention liquid H-bonds or that the liquid phase partition function is different from that of the gas phase, which is quite evident in the spectra of water phases.21,22 SRT and the model here seem to be different steps in the complex evaporation process. The focus here is on the liquid phase while SRT seems aimed at establishing equilibrium in the vapor or interface region.
Maxwellian Distributions
Almenas23 has questioned that the distribution of evaporating velocities at the liquid-gas interface is Maxwellian and explored some possibilities. Eq. 7 is the stereotype for a non Maxwellian process, whereby only higher energy modes are extracted at the interface. Such a process is entirely consistent with the many results such as Duan10et al which show a temperature increase in the gas phase on evaporation.
Discussion: Condensation and Nucleation.
The model presented here clearly has no sources of energy or of matter to sustain a given interface temperature, and it does suggest evaporation even at equilibrium. At equilibrium the mass balance must come from condensation. The energy balance between condensation, evaporation, heat transport, and radiation cannot be defined here without a clear definition of what the thickness of the surface layer is. The literature is not clear that external radiation has been fully accounted for in evaporation studies, or even considered in some cases.
The success of equation 7 seems to validate the concept of a threshold energy of evaporation, but does not establish the relevance of surface tension as an identifier of this energy except perhaps for the case of liquid water. Different crystalline phases will have different thresholds and propagation speeds. This suggests that phases where the growth and evaporation are differently coupled can lead to shapes or forms, like perhaps snowflakes. Crystal surfaces must have different evaporation rates from liquids due to the different balance between binding and kinetic energies. If different crystal forms have different evaporation rates the concept of supersaturation should be reviewed. This does not violate thermodynamics if each crystal form has a different heat of formation.
A phonon theory for evaporation obviously assumes the existence of a phase to support the phonons. It does not explain nucleation, but does suggest that the problem in nucleation is finding mechanisms to dissipate the energy of bond formation by the first few molecules. Part of the reason why water nucleates more readily than crystals may be that crystals have lower Cp from fewer phonon states to dissipate heat of condensation. Phonon theory explains condensation phase change radiation as a localized heating effect during condensation. This heat loss would promote condensation by reducing the temperature of the liquid.
The literature on condensation and evaporation is extensive and extends over decades. An excellent summary can be found in Khvorostyanov and Curry27
Temperature Changes on Evaporation
At the time it was published, the observation by Badam et al28 that there were large temperature swings between the liquid and vapor phase were surprising. The finding have been resolved in various ways, but none address the issues of condensed phase energy flow by phonons. While it is not clear what the distribution of molecular energies produced by equation 7 will be, there must be an underlying Bose-Einstein distribution of their frequencies. It is unlikely that the Maxwellian statistical properties of the external vapor phase will match the statistics produced by Equation 7. Even when the mass flows are at equilibrium a difference in temperature is possible when radiation flows are imbalanced.
Summary
The unusual distribution of phonon states of water as compared to classical Debye theory is consistent with both the electrical properties of water and the observed modes of phase change radiation.
A model that is consistent with the evaporation results and the bulk phonon distributions is the following. To release a water molecule on the surface requires an amount of energy that is roughly equivalent to a single hydrogen bond. Energy for the release process is transmitted to the evaporating molecule through the bulk phonon modes, which also serve to redistribute energy of condensation or external radiation.
It appears that Equation 7 is consistent with existing evaporation and kinetic theory, and is consistent with phonon distributions that could provide evaporative energy.
Once a molecule has left the surface, any remaining energy necessary to satisfy the total heat of evaporation must come from the bulk liquid as it reorganizes to create the new surface. This is consistent with the common observation that evaporating water causes cooling of the remaining bulk liquid.
Acknowledgements
This analysis could not have existed but for Elton’s excellent proof of water phonons, and for Almedas23 prompting. The relation between heat radiation and phonons is found in Schwartz16, Smerlak24 and Ashcroft/Mermin25. The work of Chaplin22 on water is invaluable. The author is grateful to Paul Croce, who has provided both critical feedback and detailed editing.
References and Notes
[1]Knudsen, M . , The Kinetic Theory of Gases (New York: John Wiley & Sons,
Inc., 1950), 3rd ed., p. 2
[2] Kazemi, Mohammad Amin; Nobes,David S.; Elliott, Janet A. W;
Experimental and Numerical Study of the Evaporation of Water at Low Pressures
Langmuir 2017, 33, 18, 4578–4591
Publication Date:April 26, 2017
https://doi.org/10.1021/acs.langmuir.7b00616
[3] Naserifar, Saber; Goddard, William A, III;
Liquid water is a dynamic polydisperse branched polymer
PNAS Vol. 116, No. 6 ; January 24, 2019; 116 (6) 1998-2003
https://doi.org/10.1073/pnas.1817383116
[4] Elton, Daniel 2016 PhD Thesis: Understanding the dielectric properties of water
URI: http://hdl.handle.net/11401/76639
https://ir.stonybrook.edu/xmlui/handle/11401/76639
[5] Elton, D., Fernández-Serra, M. The hydrogen-bond network of water supports propagating optical phonon-like modes. Nat Commun 7, 10193 (2016). https://doi.org/10.1038/ncomms10193
[6] https://en.wikipedia.org/wiki/Electromagnetic_absorption_by_water 8 Aug 2023
The chart shows absorption spectra for the three phases of water. It is notable that ice and water are quite similar at wavelength shorter than 10 microns where the vapor shows substantial fine structure.
[7] Peluso, Fabio; Isochoric Specific Heat in the Dual Model of Liquids
Liquids 2021, 1(1), 77-95
https://doi.org/10.3390/liquids1010007
[8] MOPAC the Molecular Orbital PACkage, is fascinating software for performing quantum chemistry calculations based on semiempirical thermochemistry models. MOPAC has been under active development since 1981, led by James J. P. Stewart. Some of the code used here came from Indiana University Quantum Chemistry Program Exchange but MOPAC is available from more modern sources.
MOPAC2022 J.J.P. Stewart, Stewart Computational Chemistry, Colorado Springs, CO, USA
https://github.com/openmopac/mopac/releases
MOPAC has multiple Hamiltonians. The PM6-ORG does a better job of matching the energies than PM3 but qualitatively produces the same shape G and g functions. I used PM3 because the Excel plot was better.
[9] Papoular; Molecular phonons and their absorption/emission spectra from the far-IR to microwaves
Monthly Notices of the Royal Astronomical Society, Volume 450, Issue 3, 01 July 2015, Pages 2539–2550, https://doi.org/10.1093/mnras/stv799
[10] Duan,Fei; Ward, C. A,; Badam, V. K.; Durst, F:
Role of molecular phonons and interfacial-temperature discontinuities in water evaporation
Phys. Rev. E 78, 041130 – 30 October 2008
DOI:https://doi.org/10.1103/PhysRevE.78.041130
[11 ] Kittel, “Introduction to Solid State Physics”, Eighth Edition, p. 108. Kittel uses a double summation. Only one is needed since the MOPAC list is across three dimensions.
[12]Wang, Kuo-ting “phase-change radiation of water.
Doctor of Philosophy 2011
University of Illinois at Urbana-Champaign, Urbana, Illinois
[13] Wu, WEI-HSUAN; TEMPERATURE EFFECT OF PHASE TRANSITION RADIATION OF WATER
THESIS Master of Science in Mechanical Engineering
University of Illinois at Urbana-Champaign, 2012 Urbana, Illinois
https://core.ac.uk/download/pdf/4838856.pdf page 10
https://core.ac.uk/reader/4837570
[14] Vitali A. Tatartchenko, Pavel V. Smirnov, Yong Wu; First Order Phase Transitions as Radiation Processes Optics and Photonics Journal, 2013, 3,1-12 http://dx.doi.org/10.4236/opj.2013.38A001 https://www.scirp.org/pdf/OPJ_2013121109053764.pdf
[15] The Review of the Phase Transition Radiation Huanrong Xiea, Mingyan Zhu b,Biao Zhangb,Xin Guan
Energy Procedia 16 (2012) 997 – 1002 1876-6102 © 2011 Published by Elsevier B.V. Selection and/or peer-review under responsibility of International Materials Science Society. doi:10.1016/j.egypro.2012.01.159
[16] Schwartz, Matthew; Statistical Mechanics, Spring 2021; Lecture 11: Phonons and Photons, 8 Aug. 2023; https://scholar.harvard.edu/files/schwartz/files/11-phononsphotons.pdf
[17] Peluso, Fabio; How Does Heat Propagate in Liquids Liquids 2023, 3(1), 92-117; https://doi.org/10.3390/liquids3010009
[18] https://en.wikipedia.org/wiki/Effusion 28 Jan 2024
[19]Enhanced Distillation Under Infrared Characteristic Radiation Kuo-Ting Wang, M. Quinn Brewster and Wei-Hsiang Lai
28 June 2017 https://cdn.intechopen.com/pdfs/54673.pdf http://dx.doi.org/10.5772/67401
[20] Kazemi, M. A; Ward, C.A.; Assessment of the statistical rate theory expression for evaporation mass flux International Journal of Heat and Mass Transfer V. 179, November 2021, 121709 https://doi.org/10.1016/j.ijheatmasstransfer.2021.121709
[21 ] Sune Dalgaard Ebbesen: https://www.researchgate.net/figure/ATR-IR-spectrum-of-water-on-ZnSe-IRE_fig6_47430641 25 Aug. 2023.
[22] Martin Chaplin: https://water.lsbu.ac.uk/water/water_vibrational_spectrum.html 25 Aug 2023
[23] Almenas, Kazys; Evaporation/Condensation of Water. Unresolved Issues. January 2014Publisher: Vytautas Magnus University ISBN: 978-609-467-098-5 (print) 978-609-467-097-8 (online)
https://www.researchgate.net/publication/275027122_EvaporationCondensation_of_Water_Unresolved_Issue
[24] Smerlak,Matteo; A Blackbody is not a black box https://arxiv.org/pdf/1010.5696
[25] Ashcroft/Mermin “Solid State Physics”
[26] https://avogadro.cc/ Avogadro is an advanced molecule editor and visualizer
[27] Thermodynamics, Kinetics, and Microphysics of Clouds by Vitaly Khvorostyanov and Judith A. Curry; Cambridge University Press 2014 ISBN 978-1-107-01603-3
[28] V.K. Badam a,* , V. Kumar a , F. Durst a , K. Danov; Experimental and theoretical investigations on interfacial
temperature jumps during evaporation; Experimental Thermal and Fluid Science 32 (2007) 276–292
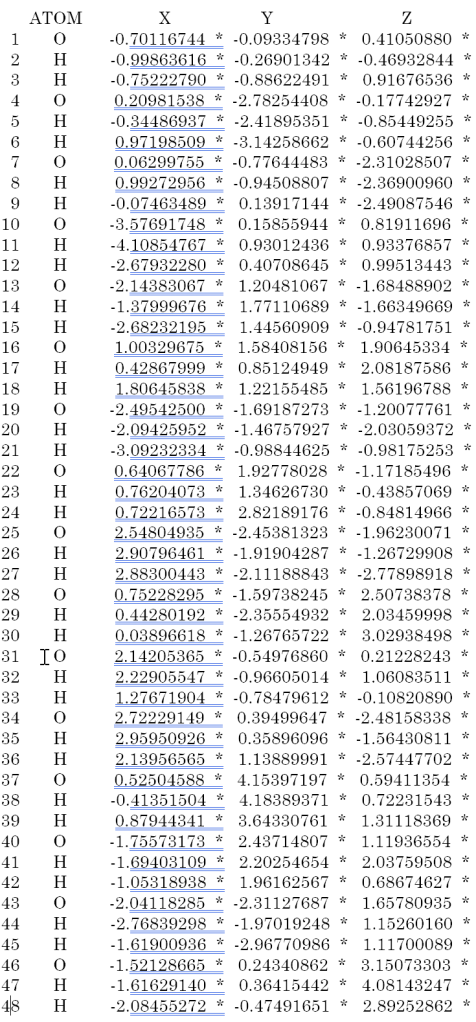
Appendix: 16 Molecule Blob using Mopac PM6-ORG
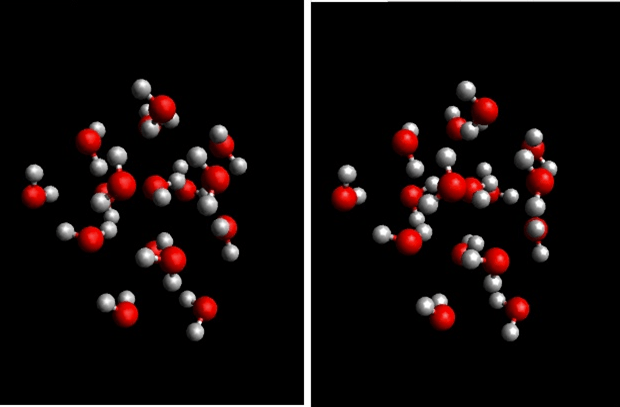
Crossed Pseudo-Stereo Pair of Blob of 16 Waters using Avogadro26
Coordinates in angstroms of a 16 molecule blob used with MOPAC PM6-ORG. This is a subset of the blob used in Figure 1.

Critical comments accepted.