Perhaps the best evidence for phonons in water is the high heat capacity of liquid water.
Usually in chemistry greater volume is associated with higher heat capacity. This can be a consequence of greater numbers of possible vibration states or just more electrons available to contribute. Yet water liquid with higher density than ice (1.00 vs 0.92 g/cm3) has roughly double the heat capacity of the solid.
The heat capacity of ice approaching the melting point is ~2.1 J/gC or 37.8 J/mK . A few degrees higher and the heat capacity doubles to 75.3 J/mK. This is an increase of (75.3 – 37.8) = 37.5 J/mK. The doubling suggests a dramatic change in how energy is partitioned in the liquid phase.
The math for the classical Einstein model for internal energy of vibrations is shown in Eq 5 of https://waterphonons.blog/2025/01/07/phonons-and-evaporation/ The derivative with respect to temperature of this function is the specific heat.
Using the MOPAC PM3 density of states (DOS) of a liquid water blob with 65 waters and assuming two polarization modes for each frequency, the heat capacity at 25oC is 36.982*2 = 73.96 J/mK. Different blob sizes and MOPAC Hamiltonians have different capacities, ranging from 37*2 to 40*2 J/mK at 298K. Note that PM3 does not have hydrogen bond correction.
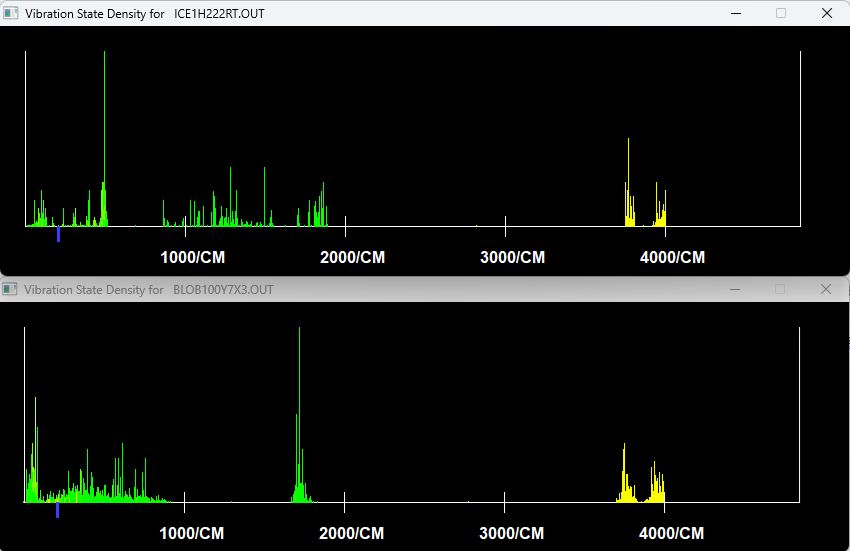
The paper “Understanding the vibrational density of states of liquids using instantaneous normal mode theory” by Jin et al. describes both the math behind the calculations (Appendix A) and the dramatic shift in DOS between ice1h and liquid water. ArXiv:2304.14609v2. MOPAC uses the Hessian matrix calculation for its density of states. The paper shows the DOS for ice and water using neutron scattering. Plots of MOPAC DOS for a blob and for ice follow below. The ice calculation requires a bit of fudging of periodic boundary conditions to keep from melting the ice with MOPAC’s room temperature parameterization.
At 100oC heat capacity is back to 2.0 J/gC=36.5 J/mK. Presumably the vapor phase is mostly isolated molecules, for which the ideal gas heat capacities are Cv=3R,Cp=4R=33.2 J/mK.
In the following plots, both graphs have approximately 875 vibration lines. The blue tic on the lower left of each plot is KT at room temperature. It is clear the liquid state has a much greater variety of lower energy states in which to store energy. Yellow modes are “radial” in MOPAC terms.
To convert a density of states in meV to energy use (8.07/cm) per meV.
View post as PDF file.


Critical comments accepted.